Suggested Topics

Please Tweet with any suggested topics for future blogs.

Tuesday, July 29, 2014

AllNet Labs July National Carrier Reports

For the rest of this week, AllNet Labs is discounting each of its National Carrier Reports to $199 (regular $495).  To receive this discount, enter discount code 8U1NXU4PCYNM during your check out process.  Selecting the report name below will take you to our store where you can add the report to your cart.

July's National Carrier Reports highlight the effects of recent spectrum transactions including Verizon's purchase of Cincinnati Bell, AT&T's purchase of Sprint's WCS spectrum, as well as many smaller transactions filed prior to 7/1/2014.

The National Carrier reports reduce the time and money spent researching the effects of hundreds of FCC transactions on the National Wireless Carriers (Verizon, AT&T, Sprint, and T-Mobile).  The National Carrier reports provide monthly visibility to each national carrier's Spectrum Holdings, available LTE Channels, and Peak Downlink Throughput for the 100 most populated markets (Cellular Market Areas) in the United States.  The National Carrier reports are delivered as Excel workbooks showing both summary information  for each carrier as well as spectrum band details.

Wednesday, July 16, 2014

Will Rural America get a 3rd National Wireless Provider?

The news yesterday that T-Mobile and Sprint are forming a Joint Venture to buy 600MHz Broadcast Incentive Auction spectrum shows a shift in the way that both Sprint and T-Mobile look at the places that aren't  in non-Top 100 markets, along Interstates, or along US Highway routes.  

Will the T-Mobile/Sprint JV use this low band spectrum to fill out the areas that they rely on partners (primarly AT&T and Sprint) to provide their coverage? 

Virtually all of T-Mobile's recently acquired 700MHz A band spectrum is in large cities (see my post from 11/2013) and Sprint has been reluctant to add towers in rural areas to utilized the 7MHz of low band SMR spectrum that they are using elsewhere for their Spark service.

Sprint's Current Coverage

T-Mobile Coverage (Light Pink indicates Partner Coverage)


T-Mobile has signaled with the FCC that they are concerned about reasonable roaming rates and Sprint is clearly in the same position with Verizon, needing Verizon's coverage to offer true nationwide coverage.  On the other side of the coin, T-Mobile indicates that they already cover 96% of the US population, leaving about 12.5 million POPs to be covered with this new low band spectrum.

For both T-Mobile and Sprint a build out in these uncovered areas would reduce their risk of of significant rate increases or roaming service elimination with Verizon and AT&T, but these towers would be much less efficient than towers elsewhere in their collective networks.  Obviously they would share the deployment costs and operating cost, but with these towers would have serve a low number of POPS (population)/Tower which is a standard industry metric on capital efficiency for deployed towers.

How would this affect Sprint's recent regional partners?
Sprint Regional Partners
Building out this spectrum would put Sprint in direct competition with these recent formed partners.  These regional partners may also participate in the auction acquiring more spectrum.  Each of these partners only needs low band spectrum for wide area coverage, and there are ample amounts of mid-band (PCS/AWS) spectrum in these areas for these regional partners to uses as capacity grows.


Tuesday, June 17, 2014

Sprint and T-Mobile, A Deeper Look

The first place to start on the rumored Sprint / T-Mobile merger/acquisition is to look at the merged entity's total spectrum holdings. AllNet Lab's Spectrum Analysis Tool with June 2014 FCC data was used for this analysis.  The Spectrum Analysis Tool is available at www.allnetlabs.com along with National Carrier Spectrum Holding and LTE Channel reports.  In the map below, you can see the counties where the the spectrum held will exceed the spectrum screen (Orange) or will greatly exceed the spectrum screen (Red).  In addition, you can see that in some counties the merged entity will have up to 374MHz of spectrum.
To see how this spectrum depth relates to the population that the licenses cover, we created a histogram evaluating the population covered by different spectrum depths.  The red line below indicates the sum of population in areas with similar spectrum depth.  For example, there are 10 million people in areas where Sprint/T-Mobile has 200MHz of spectrum and 79 million people in areas where Sprint/T-Mobile have 280MHz of spectrum.

The green line indicates the sum of the population as you increase the range from left to right.  For example, there are 1 million people in areas where Sprint/T-Mobile have 20MHz or less spectrum.  Considering a 195MHz spectrum screen, you can see that only 47 million people live in areas where Sprint/T-Mobile will be below the spectrum screen, thus Sprint/T-Mobile exceeds the spectrum screen over 85% of the US population.


Our last analysis summarizes the MHz-POPs for Sprint/T-Mobile by spectrum band.  WCS spectrum is listed but it is being transferred to AT&T.  Sprint's EBS/BRS spectrum still accounts for 55% of the combined entities MHz-POPs although the combined AWS and PCS spectrum represents 36%.  Using the MHz-POPs values, we can develop a National Average of Sprint/T-Mobile's spectrum holdings.  Looking again at the AWS and PCS spectrum holdings, Sprint/T-Mobile would average 38MHz of AWS spectrum and 65MHz of PCS spectrum across the country.


AllNet Lab's Spectrum Analysis Tool is an Excel based product which allows users to visualize and analyze the current spectrum ownership for all of the mobile carrier and satellite frequency bands at a county level for all 50 states and US territories.  The Spectrum Analysis Tool includes 15 color-coded spectrum holders and over 600 additional identified carriers.

Monday, March 3, 2014

National Carrier LTE Channels - Top 100 CMA Markets

AllNet Labs is now offering a monthly spectrum report summarizing the LTE Channels for the National Carriers (Verizon, AT&T, Sprint, and T-Mobile).  To develop this report, AllNet Labs takes the spectrum outputs at a county level from its Spectrum Analysis Tool and applies a county population weighting before averaging all of the counties within a Cellular Market Area (CMA).  Data is available for all 733 CMA markets, but the standard report is formatted for the 100 most populated CMA markets.  This report is delivered as an Excel spreadsheet, with both summary and detailed views.  In the summary view (Figure 1), only the size and quantity of LTE channels for each carrier are displayed. This report evaluates each carrier’s complete spectrum holdings to determine the size and quantity of available LTE channels.  The report also assumes that the largest channel would be utilized rather than multiple smaller channels (e.g. a 20MHz channel is assumed rather than 2 – 10MHz channels).
Figure 1
By selecting the [+] in the upper margin to the right of AT&T’s 10x10 column we can reveal t AT&T’s LTE channel distribution by band.  This expanded view is seen below as Figure 2. 

Figure 2
AllNet Labs has added a proposed transaction data set to the Spectrum Analysis Tool.  With this data set, we are able to simplify hundreds of license transfers at the FCC into the net effect for wireless operators.  All of the transactions are captured from the FCC Daily Digest and each license is updated at the callsign, county, and frequency levels.  Using this proposed transaction data; a matrix of each carrier’s future LTE Channels is created (Figure 3). 

Figure 3
By selecting the [+] signs in the upper margin, a carrier’s spectrum holdings by band can be detailed.   (Figure 4).

Figure 4
The last matrix in this report summarizes the differences between the proposed LTE Channels and the current LTE Channels.  This highlights areas that are affected by proposed transactions.  The example shown uses data from the December 2013 Spectrum Analysis Tool.    The proposed transactions for December 2013 were transactions announced prior to 12/1 which included AT&T’s purchase of Leap as well as many other minor transactions.  The effect of that transaction as well as other more minor transactions is easily seen in Figure 5, with AT&T increasing their LTE channel size from 5x5 to 10x10 in Chicago.

Figure 5
To see the changes at the spectrum band level of detail, select the [+] in the upper margin as described before.  As seen in Figure 6, AT&T’s increase in 10x10 channels in Chicago was the result of an increase in the PCS spectrum band.

Figure 6
AllNet Lab's Spectrum Analysis Tool is an Excel based product which allows users to visualize and analyze the current spectrum ownership for all of the mobile carrier and satellite frequency bands at a county level for all 50 states and US territories.  The Spectrum Analysis Tool includes 15 color-coded spectrum holders and over 600 additional identified carriers.  More information can be found at www.allnetlabs.com.

Saturday, February 22, 2014

National Carrier Spectrum Holdings - Top 100 CMA Markets

AllNet Labs is now offering a monthly spectrum report summarizing the spectrum holdings for the National Carriers (Verizon, AT&T, Sprint, and T-Mobile).  To develop this report, AllNet Labs takes the spectrum outputs at a county level from its Spectrum Analysis Tool and applies a county population weighting before averaging all of the counties within a Cellular Market Area (CMA).  Data is available for all 733 CMA markets, but the standard report is formatted for the 100 most populated CMA markets.  This report is delivered as an Excel spreadsheet, with both summary and detailed views.  In the summary view (Figure 1), only the total spectrum holdings for each carrier are displayed.
Figure 1
By selecting the [+] in the upper margin to the right of AT&T spectrum holdings we can reveal  AT&T’s spectrum distribution by band.  This expanded view is seen below as Figure 2.
Figure 2
AllNet Labs has added a proposed transaction data set to the Spectrum Analysis Tool.  With this data set, we are able to simplify hundreds of license transfers at the FCC into the net effect for wireless operators.  All of the transactions are captured from the FCC Daily Digest and each license is updated at the callsign, county, and frequency levels.  Using this proposed transaction data, a matrix of the national carrier’s proposed spectrum holdings is created (Figure 3).  
Figure 3
 By selecting the [+] signs in the upper margin, a carrier’s spectrum holdings by band can be detailed.   (Figure 4).
Figure 4
The last matrix in this report summarizes the differences between the proposed spectrum holdings and the current spectrum holdings.  This highlights areas that are affected by proposed transactions.  The example shown uses data from the December 2013 Spectrum Analysis Tool.    The proposed transactions for December 2013 were transactions announced prior to 12/1 which included AT&T’s purchase of Leap as well as many other minor transactions.  The effect of that transaction as well as other more minor transactions is easily seen in Figure 5, with AT&T increasing their spectrum holdings in 6 of the 15 CMA markets listed.
Figure 5
 To see the changes at the spectrum band level of detail, select the [+] in the upper margin as described before.  As seen in Figure 6, AT&T’s increase in spectrum was the result of increases in AWS and PCS spectrum, which matches the known spectrum that Leap will bring to AT&T.
Figure 6
 AllNet Lab's Spectrum Analysis Tool is an Excel based product which allows users to visualize and analyze the current spectrum ownership for all of the mobile carrier and satellite frequency bands at a county level for all 50 states and US territories.  The Spectrum Analysis Tool includes 15 color-coded spectrum holders and over 600 additional identified carriers.  More information can be found at www.allnetlabs.com.

Monday, November 25, 2013

700 MHz A Block Owners (Map) and Top 20/50 Analysis

With the recent industry press indicating that T-Mobile was positioning its self to purchase Verizon's 700 MHz A Block, I decided to dive into the Spectrum Analysis Tool to see what kind of geographic area Verizon's licenses would provide T-Mobile with low band spectrum.  
Clearly it would not be a spectrum purchase to provide coverage in rural areas since it doesn't address the rural areas in the western United States with the exception of western Colorado.  Looking at it on a Cellular Market (CMA) basis, this spectrum would provide T-Mobile with low band spectrum in all 15 of the Top 20 markets but only 25 of the Top 50 markets.  This includes both the Verizon spectrum and T-Mobile's 700MHz spectrum acquired from MetroPCS.

To acquire the remaining 700 MHz A block spectrum in the Top 20 markets, T-Mobile will need to be talking to:

Leap - Chicago
US Cellular - St. Louis
McBride Spectrum - Pittsburg
Cox - San Diego
Vulcan - Seattle

Tuesday, November 19, 2013

LTE Band Class Updates

As I was completing my research for an upcoming blog on LTE Carrier Aggregation, I found that my previous LTE Band Class reference sheet was missing some of the more recent Band Class updates, so I decided to share my new reference document with a few comments.

FDD Band Classes:


The first notable band class addition in Band 30.  This band class creates a definition for FDD operation in the WCS (2.3GHz) band which was previously defined only for TDD operation.
From the Spectrum Grid view of the Spectrum Ownership and Analysis Tool, you can see that Band 30 does not include the 5MHz channels that AT&T purchased to essentially become guard bands for the Satellite Audio guys.  This will provide AT&T with a 10x10 LTE channel on a market by market basis, as they resolve the remaining ownership issues in the WCS band.

The next two band classes are not new, but I previously skipped over these band classes because I didn't fully understand their frequency breaks.

Band 26
Previously I thought this was a specific band for Sprint  IDEN operation that is adjacent to the cellular band.  This is the band where Sprint is placing their 2nd LTE channel (5 MHz) and a CDMA channel (1.23 MHz). Looking at the frequencies in detail, the band class covers the IDEN spectrum and the adjacent cellular spectrum.

This is similar to Sprint's Band 25 which includes all of the PCS band plus their G block spectrum (but not the H block).


So you would think that all of the North American carriers could standardize to Band 25 for PCS operation and Band 26 for Cellular. Using the latest iPhone 5s LTE band support,
you can see the Verizon, T-Mobile, and AT&T iPhone's support Band 2 and 25 for PCS, but only the cellular band (Band 5).  Sprint iPhone 5s includes,
both Band 2 and 25 for PCS and Band 5 and 26 for cellular.

Band 10:
This is referenced as the AWS extended band and you can note from above that it is not currently applied to smartphones like the iPhone 5s.  This band class seems to be a preparation for the future use of the AWS-2 and AWS-3 spectrum and the government shared use band that are both adjacent to the existing AWS spectrum band.  Here is how the downlink looks in the Spectrum Ownership Analysis Tool:
Note that Band 10 does not cover the entire band contemplated for AWS-3, nor does it include Dish's Band 23.  For the uplink:

This again depicts that Band 10 is not currently set to include the entire shared government opportunity.

TDD Band Classes:
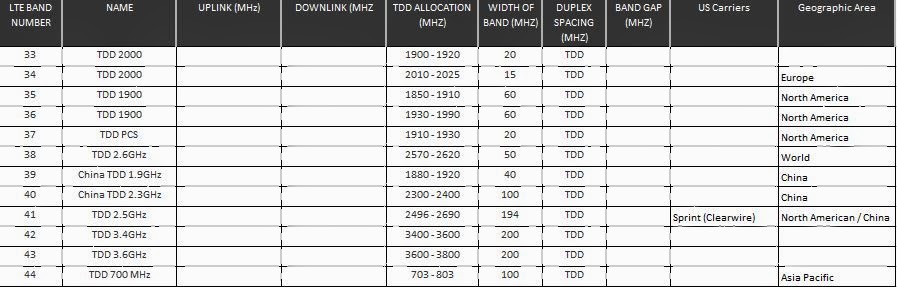
Here is the reference sheet the TDD band classes.

On this reference sheet I hadn't looked closely at band classes 35, 36, and 37.  I had always focused on the 2.3GHz and 2.5GHz as the only bands that were designated for TDD support in North America.  These three band classes create 140MHz block of spectrum that could be for TDD deployment.  Here is how these bands appear in the Spectrum Ownership Analysis Tool:
I'm not sure what the history is on these band classes, but they would support TDD operation in both the PCS uplink and downlink bands as well as in the 20 MHz between the bands.  Since the PCS frequencies are highly deployed, I would consider it very unlikely to see TDD systems in this band in the near future, and I doubt that the PCS band is authorized for TDD operation.  It will be interesting to see whether any of the wireless carriers begin to look this direction.  With Sprint stepping out of the H block auction, they seem to be signalling that TDD operation is more important to them and the Band 37 block (including Sprint's G block) could be the reason why Dish is pushing forward in the H block auction.  Please comment if you are aware why the 3GPP has included these 3 TDD band classes.