Yesterday, the FCC approved a Channel 51 transition in Dayton, OH. The movement of this TV station from Channel 51 to Channel 18, will eliminate the adjacent channel interference risk to T-Mobile's 700MHz A-Block spectrum in Denver. Below is a listing of the currently filed Channel 51 transitions. The Dayton, OH transition is linked to the FCC filings. The previous filings are linked in previous postings. Previous postings can be accessed the the Channel 51 label.
| Final Daily Digest | Initial Daily Digest | Market | Call Sign | Current Channel | Proposed Channel |
| 12/13/2013 | Oklahoma City, OK | KSBI(TV) | 51 | 23 | |
| 9/4/2014 | Rome, GA | WPXA(TV) | 51 | 31 | |
| 9/4/2014 | Kansas City, MO | KPXE-TV | 51 | 30 | |
| 12/23/2014 | 9/18/2014 | Dayton, OH | WKEF(TV) | 51 | 18 |
| 12/16/2014 | 10/17/2014 | Denver, CO | KCEC(TV) | 51 | 26 |
| 12/8/2014 | Longview, TX | KCEB | 51 | 26 |
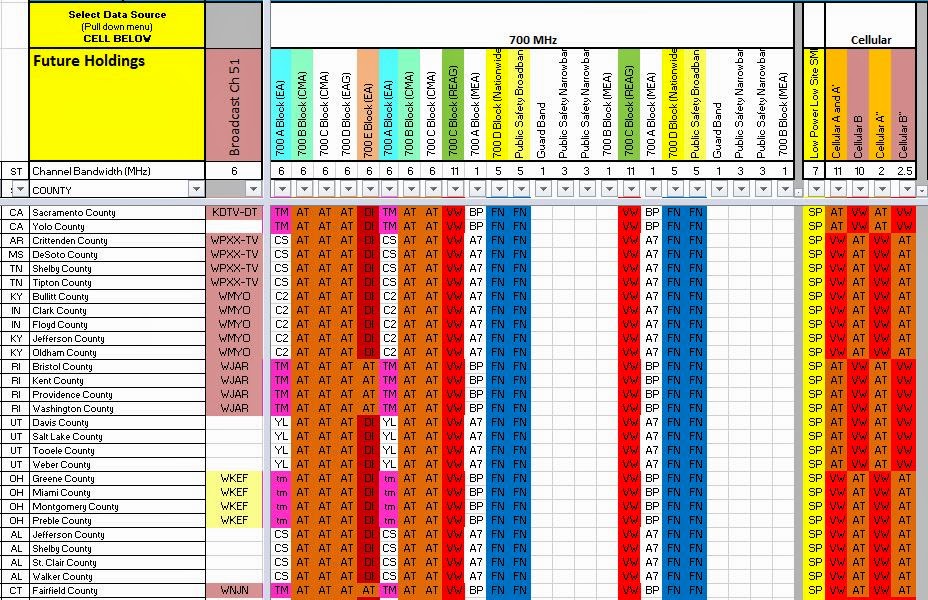
Our Spectrum Ownership Analysis Tool has incorporated the Channel 51 interference issue into our Spectrum Grid module. From this module, you can see the 700MHz A-Block owner and an indication of whether Channel 51 is licensed in that particular county. Green highlights over the Channel 51 callsign indicate that a transition plan has been approved, yellow highlights indicate that a transition plan has been filed, and red highlights indicate the markets where interference issues will persist.